


Being an HVAC contractor in the digital age means you likely have some online presence. Maybe you have a company website. Or perhaps you dove headfirst into the world of Facebook, Instagram, TikTok, or all the above. In any case, having a digital presence puts your business on customers’ radar when they need an HVAC contractor to repair, upgrade, or replace their system.

Having a strong, deliberate online presence can bring additional sales to your company. However, getting customers to engage with your company online isn’t as simple as creating a social media page or website and writing posts to your heart’s content.
You need to look at numbers and draw conclusions about your marketing strategies to get customers’ attention. It’s a lot like gathering static pressure and airflow readings when diagnosing a problem in the field.
Just as you test and measure in the field and analyze those readings to help inform your diagnostic process, you can look at statistics and analyze them to forge a marketing strategy that brings actual results. That’s called “marketing analytics.”
What is Marketing Analytics?
Broadly speaking, marketing analytics is how we convert measured numbers into insights we can use to make decisions.
social media management software that can provide analytics reports.
It’s a skill HVAC technicians already use in the field. When they go to a customer’s home and measure static pressures, the numbers read on the gauges or apps might not mean much to the average person. But your technicians can tell if the HVAC system has high, low, or normal pressure.
We attach a meaning to those numbers by comparing them to what’s normal, which informs our diagnostic processes.
Let’s say you measure a total external static pressure of 0.9-in. w.c. when the maximum rated pressure drop is 0.5-in. w.c. Your average Joe won’t know what a pressure drop of 0.9-in. w.c. means, but professional HVAC technicians will know that it’s high! The high static pressure will inform the technician’s next move as they attempt to diagnose the problem—and, eventually, fix it.
Like Versus Subscribe
The same principle applies in the digital world. We can see how many people liked our posts or subscribed to a newsletter. Still, those numbers don’t help educate and reach potential customers unless we understand what they mean.
Now, if we notice trends where before-and-after photos get more likes and comments than sales infographics, we’ll know to post more before-and-after photos to interest more customers.
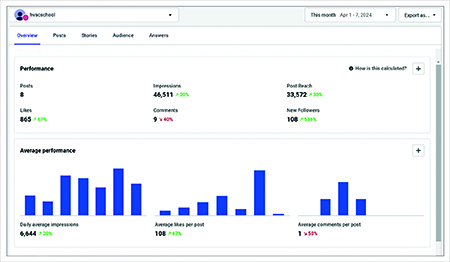
Generally, marketing analytics could be as simple as watching trends in how many likes, comments, clicks, etc. we receive per post on our website or social media outlets.
We’re taking numbers, understanding what sorts of insight they give us about the health of our marketing strategies, and using them to decide future steps. That sounds like what we’d do to diagnose an HVAC system or prepare a duct upgrade, doesn’t it?
Basic Metrics
There are a few metrics you’ll likely come across in the world of marketing analytics:
- Bounce – In Google Analytics [GA4], the bounce rate refers to sessions that are not engaged (see Engagement below). In email marketing, bounces are failed deliveries.
- Click – An instance where someone clicks on a link in your social media posts, emails, or websites.
- Engagement – A measure of interactivity with your content. If someone likes or comments on a social media post, that counts as engagement. On websites, specific criteria may signify if a user is engaging with the content (for example, spending 10 seconds on a page, scrolling down 90% of a page, or viewing at least two pages on a website).
- Fans, followers, or subscribers – People who receive updates from your social media page, blog, or newsletter.
- Impressions – In social media analytics, impressions are the number of times a post appears on someone’s feed; it does NOT necessarily measure engagement. (It’s like the number of cars that pass a “Garage Sale” sign, regardless of how many people pass it multiple times or end up going to the garage sale.)
- Likes (or reactions)– The number of people that interacted with the “Like” function on a social media site (or all reactions, including “Love” and “Angry” for Facebook).
- Reach – In social media analytics, reach is the number of unique people who saw a post or page. (Unlike impressions, reach would be the number of unique license plates of cars that drove by a “Garage Sale” sign.)
- Session – In some analytics software, a session is a collection of user behavior across their experience on a website, including the number of page views and engagement statistics.
- Users – This term is broad in Google Analytics [GA4] and refers to anyone who visits your site; Google Analytics sorts users into a few different categories based on their behavior, including:
- Total (all users)
- New (first-time users as indicated in the code)
- Active (engaging with the site within a specified date range in the report)
- Returning (involved in at least one previous web session on your site, regardless of engagement).
- Views – In terms of website analytics, views refer to the number of times a page is loaded on your site, whether it’s from an internal referral (another page on the site) or an external referral (such as a search result on Google). Regarding social media or YouTube videos, a view is any time someone watches a video, reel, or short.
- Visitors – The number of times your website is reached from an external source (e.g., from a search result on Google or a Facebook link).
Collecting Data for Marketing Analytics
While marketing analytics can be daunting at first glance, you can start simply. You don’t need software to collect basic data about user engagement on your website or social media platforms.
By the way, you can see how certain social media or blog posts performed by looking at how many likes or comments each post received. You may notice that posts of a specific format, length, or topic tend to receive more attention than others. It would stand to reason that something you’re doing in those posts resonates more with potential customers.
However, keep in mind that the data can mean different things; a post may have gotten more attention because it was posted at a different time of day when more of your followers or subscribers were active.
For that reason, it’s a lot easier to have software that tracks and compiles this information into reports; Buffer and Hootsuite are examples of social media management software that can provide analytics reports.
Such software shows things like engagement statistics, but they can also show you the best days and times to post social media content, as well as how often you should post, based on historical data.
When you have all the data in front of you, you can see which post times are most likely to result in the broadest reach and which post topics or formats get more engagement than others. With the numbers—and the insights—at your disposal, you can develop your marketing strategy.
We use this to automate certain campaigns, to announce upcoming events,
and to track the subsequent data.
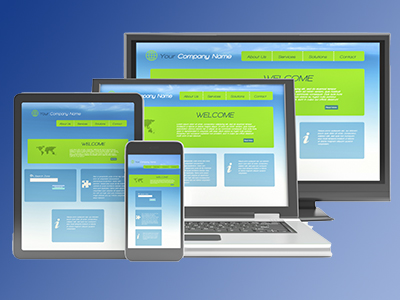
Marketing Analytics for Company Websites
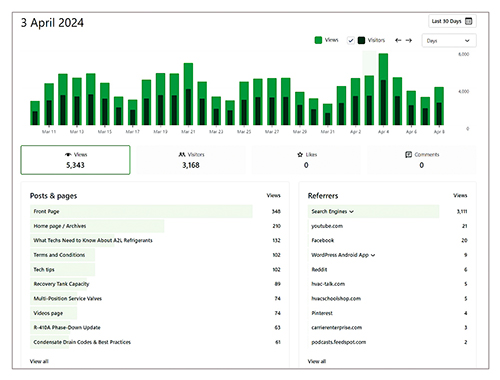
The same principles apply to websites. You can use software like Google Analytics [GA4] or a plugin from your website host (like WordPress).
We use WordPress for HVAC School and receive data about how people interact with the website via their JetPack plugin.
This feature is basic by comparison to Google Analytics [GA4], but it allows us to see how people use our site, what pages they’re viewing, and how they found the site (e.g., from search engines like Google or links on other websites), among other things.
This information can tell you what people want to see on your site and what they typed into a search engine (like Google) to find your site. Both things are great pieces of data to help generate sales leads down the line. The data can help you identify potential customer pain points that you can help alleviate with your services.
For example, prospective customers will likely search for “HVAC contractor near me” or “AC repair near me.” However, some prospective customers actively seek home solutions and might use more specific queries, like “duct renovation near me.” If your business provides the services the customers are searching for, you can use this data to shape your messaging by ensuring your web content contains the keywords customers search for.
Google Analytics [GA4] also allows you to configure your reports to collect data from specific locations. You can use this to your advantage by collecting data only from your service area. If you’re a contractor in Seattle, the web activity of a user in Miami isn’t going to generate sales leads. You can filter their data out and analyze the data that will help you generate sales leads.
Data Analytics for Newsletters and Email Marketing Campaigns
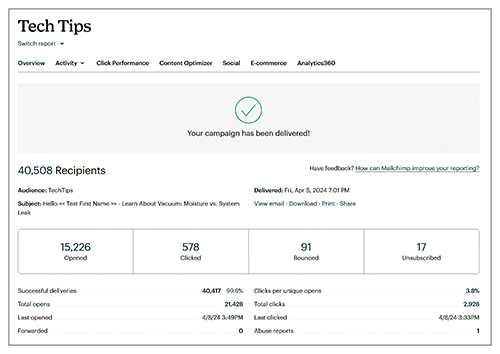
You can manage newsletters and email campaigns in bulk with software like Mailchimp or Hubspot. We use Mailchimp at HVAC School to automate tech tip notifications and send emails for specific events (like upcoming webinars and the HVACR Training Symposium).
Some plans allow you to see the analytics of your most recent campaigns, including how many people opened your email, clicked on links in the email (and which links they clicked), and unsubscribed upon receiving the email.
In cases with clicks and opens, you may also see unique clicks and opens, representing how many individual users opened the email or clicked on something. That way, a handful of users who click on things repeatedly won’t skew the data.
Let’s say you send an informative email about the importance of good static pressure and provide and include a link to a service request form, contact form, or FAQs on your website. When you look at those clicks in your analytics panel, you can easily gauge existing customers’ interest in that service by seeing how many people click on the form.
On the other hand, many people could unsubscribe from an email that seems like an aggressive sales pitch. You might not know to change your approach unless you see many unsubscribes in your analytics panel.
What To Do with Marketing Analytics in the Long Run
We know what analytics are and how to get the data we need—great! Now, what do we do with that data?
This information can then be used to fine-tune content delivery
to satisfy reader’s interests.
In some of our previous examples, you can see what’s working and not working in the short term to make quick fixes or explore a formula that seems to work so far.
In the long term, you can use analytics to appeal to people you want to work with. As you figure out what your company can offer to interest prospective customers who would be a good fit, you can attract more of those customers and solidify your company’s identity in the process.
Using analytics to drive your online marketing lets you deliberately develop your company’s image by referring to specific insights—not by posting haphazardly. You get to see which messages gain traction online. Then, you can decide how to attract customers who are a good fit for you with the insights you receive.
In addition, online messaging about your services, pricing, service processes, etc., lets customers know if your HVAC business is right for them and will address their specific pain points. That said, your business won’t address the pain points of every single prospective customer.
Big Mistake: Targeting EVERYONE
It’s normal to want to cast a wide net to get as much business as possible. However, some customers just want someone who can get their A/C unit running; these customers will likely not be interested in advanced diagnostics or upgrades, even if those items would improve their comfort and their systems’ longevity.
Some customers won’t be willing to pay the prices you ask for a thorough system diagnosis. That’s okay — customers have different goals, and you, the contractor, don’t have to try to please everyone.
Keep that in mind when you craft the messages you want the public to see. Sure, an email or post about a $59 duct cleaning special might get more clicks than an informative piece about how poor ductwork can keep an HVAC system from living up to its full potential, but is the $59 duct cleaning special really the service you want to provide?
Instead, focus on the messages that resonate with the people you are best equipped to serve. Then, nail down the online habits that get people to pay attention to your business.
Analytics for the How, NOT the What
More web traffic, clicks, and engagement on your site or social media is good. However, it shouldn’t entirely dictate your business model or the content you post.
For example, the HVAC School website analytics consistently show that A2L training is among our most highly sought-after content. At least one A2L-related tech tip consistently ranks in our site’s top 10 most-visited pages on any given week.
If web traffic was the most important thing to us, we may as well go all in and change our name to A2L School. But getting clicks by itself is not what we set out to do.
We aim to share field-applicable training about several aspects of the HVACR trade. That is our “what.” The results of that goal aren’t tangible since HVAC School is a free source, but we still focus on making our content have the highest reach possible.
However, we’ve put that into practice on our YouTube channel with successful results. When explaining scientific concepts and detailed service procedures, we’ve noticed that our 3D videos outperform our other content regarding views and likes.
Those analytics tell us that people love these videos (or maybe they’re more likely to share them with apprentices), and more people find them helpful.

After we saw that this new video format made a positive difference for our audience and our overall reach, we started creating more 3D videos to show detailed installation and service procedures.
What About Me, a High-Performance HVAC Contractor?
Just as zeroing in on A2L training isn’t HVAC School’s “what,” the $59 duct cleaning special isn’t your company’s “what.” Will an email advertisement for that $59 duct cleaning get more clicks? Probably, but clicks aren’t the most important thing.
You’re offering advanced diagnostics—and possibly some radical design solutions—to help homeowners. Your work helps them address why their HVAC equipment is reaching only about half its potential. Focus on that messaging, but pay attention to the content delivery to attract customers willing to pay for your services.
Do your customers click on links to your company’s request for service form through Facebook posts with before-and-after photos?
Do you have videos of technicians performing tests in the field or of senior techs explaining the science behind the service? That’s the information you can get from analytics, and you can embrace it to drive your online messaging.
If the analytics show that customers in your market like time-lapse videos of jobs well done more than other content, and leads to an uptick in request forms being filled out, then you’ll know to share more of those time-lapses on your social media!
However, if your newsletter subscribers aren’t opening emails with a lot of text, you know to change to something more digestible or visual.
If You Don’t Measure …
Just as it can be a bit overwhelming to think about all the readings you need to take as an HVAC technician, all the numbers involved in marketing analytics can be daunting at first. Clicks, views, visitors—it really can be overwhelming. You may collect data analytics from several sources simultaneously: your website, mailing list, and social media.
But just like when you start testing for static pressure more often, looking at your marketing analytics will help you start seeing trends. By the way, just as Bluetooth-compatible HVAC measurement apps hint at whether your readings are high or low, many analytics platforms will show you increases and decreases in the strength of your marketing efforts over time.
Once you get familiar with your numbers and understand what they’re trying to tell you, you can see them as valuable indicators for your marketing strategy.
As with anything we measure in the field, the idea is to convert numbers into insights that help determine the next step.
You can get them from various sources, each with different pricing and options, but they can help you pin down what’s grabbing your audience’s attention so you can generate more leads and share your solutions with more customers.
Emily Gutowski is the technical writer and content editor for HVAC School (founded by Bryan Orr), in Clermont, FL. She has occupied this role since 2020, the same year she graduated from the University of Florida with her Bachelor of Arts in English, and a minor in mass communication. Emily can be reached at ncilink.com/ContactMe.